Assay Analyser
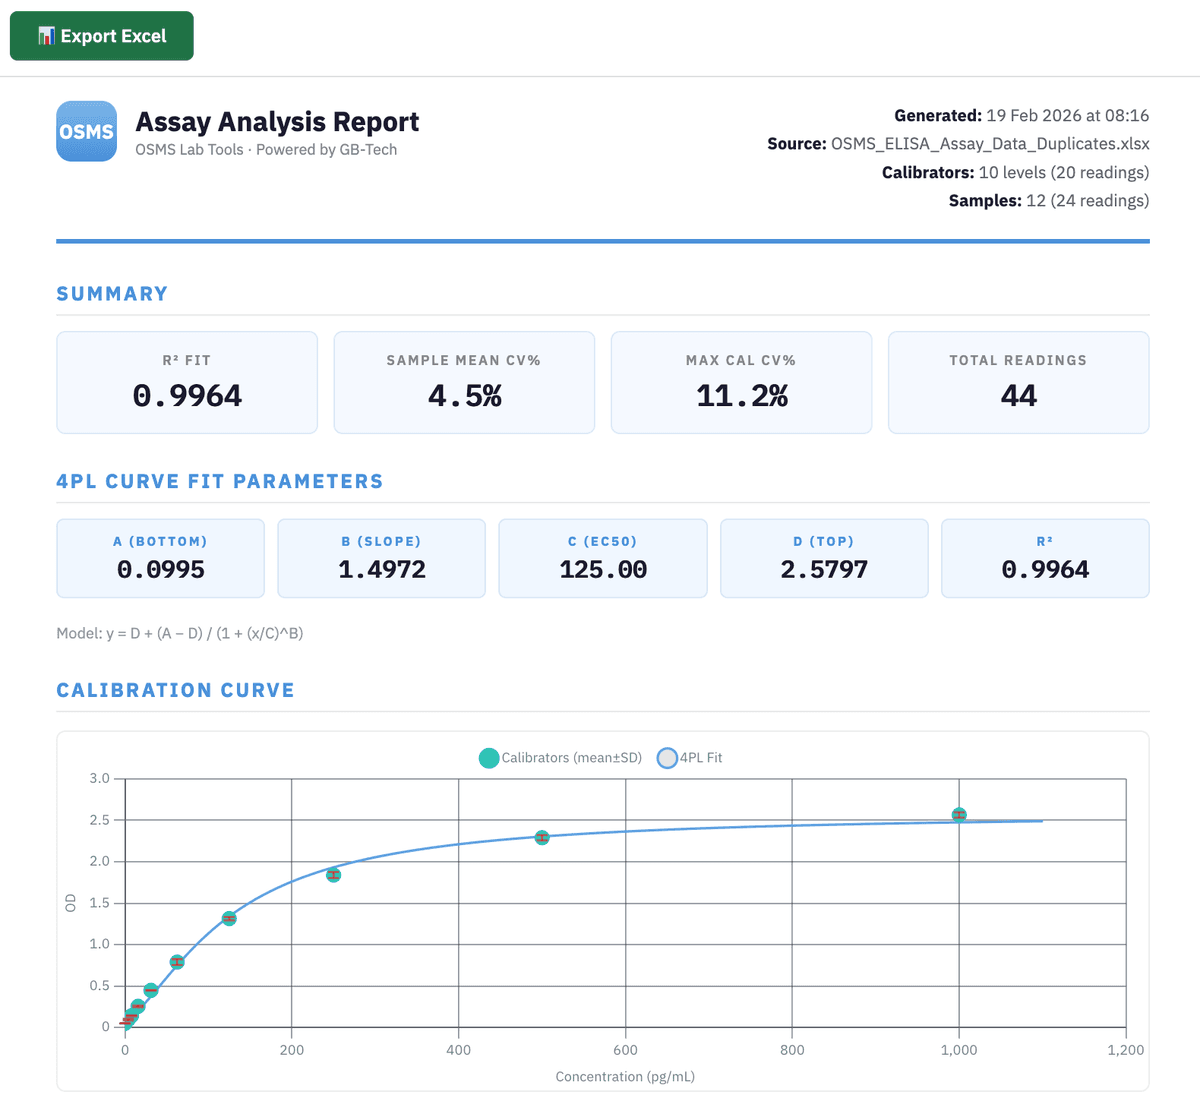
Analyse plate reader measurements or from on-chip microfluidic measurements, ELISAs and other quantitative assays. Upload your Excel file, fit a 4-parameter logistic (4PL) calibration curve, and interpolate unknown sample concentrations — with built-in QC validation and replicate statistics. Ideal for processing absorbance, fluorescence or luminescence data collected from microfluidic chips and 96 well plates.
Launch Assay Analyser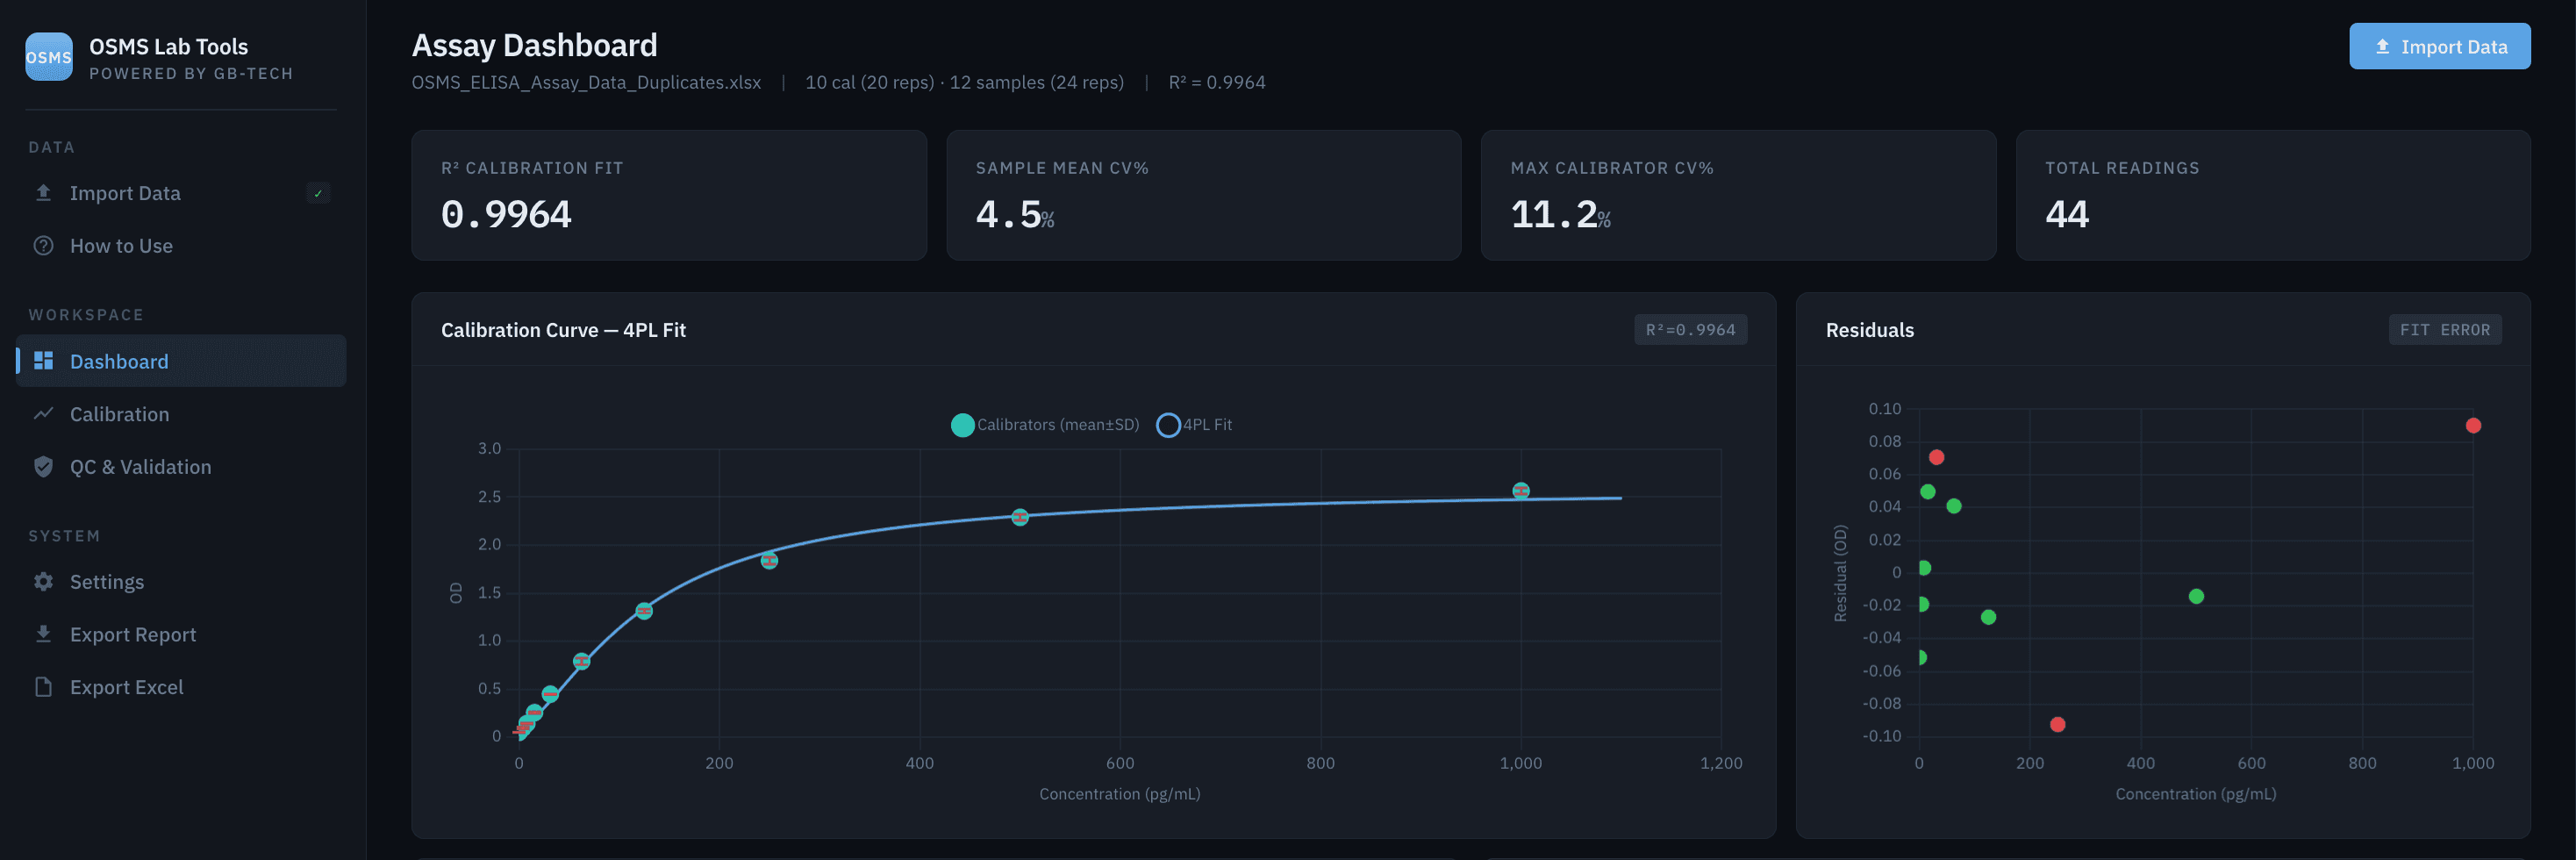
Example Assay Report
How to Use
Data Format
Your Excel file needs 3 columns(or 4 for triplicates). One row per calibrator or sample. The tool auto-detects calibrators vs samples from column A:
| Column | Calibrator Rows | Sample Rows |
|---|---|---|
| A | Known concentration (e.g. 125) | Sample name (e.g. "Patient 03") |
| B | Replicate reading 1 | Replicate reading 1 |
| C | Replicate reading 2 | Replicate reading 2 |
| D (optional) | Replicate reading 3 | Replicate reading 3 |
Example Layout
| Column A | Rep 1 | Rep 2 |
|---|---|---|
| 0 | 0.048 | 0.052 |
| 3.9 | 0.090 | 0.056 |
| 15.6 | 0.261 | 0.248 |
| 125 | 1.327 | 1.299 |
| 1000 | 2.583 | 2.536 |
| Patient 01 | 0.149 | 0.143 |
| Patient 02 | 0.352 | 0.344 |
Import Steps
- 1. Click Import Data in the sidebar
- 2. Drop your
.xlsxfile or click Browse - 3. Auto-detection scans column A — numbers are calibrators, text entries are samples, empty rows are skipped
- 4. Review detected rows and adjust if needed
- 5. Click Analyze to review the 4PL fit
- 6. Click Load Dashboard — done
Tips
- Blank calibrators: use 0 in column A (not empty)
- A header row with text in all columns is auto-skipped
- Separate calibrators from samples with one empty row (optional but recommended)
- Supported formats:
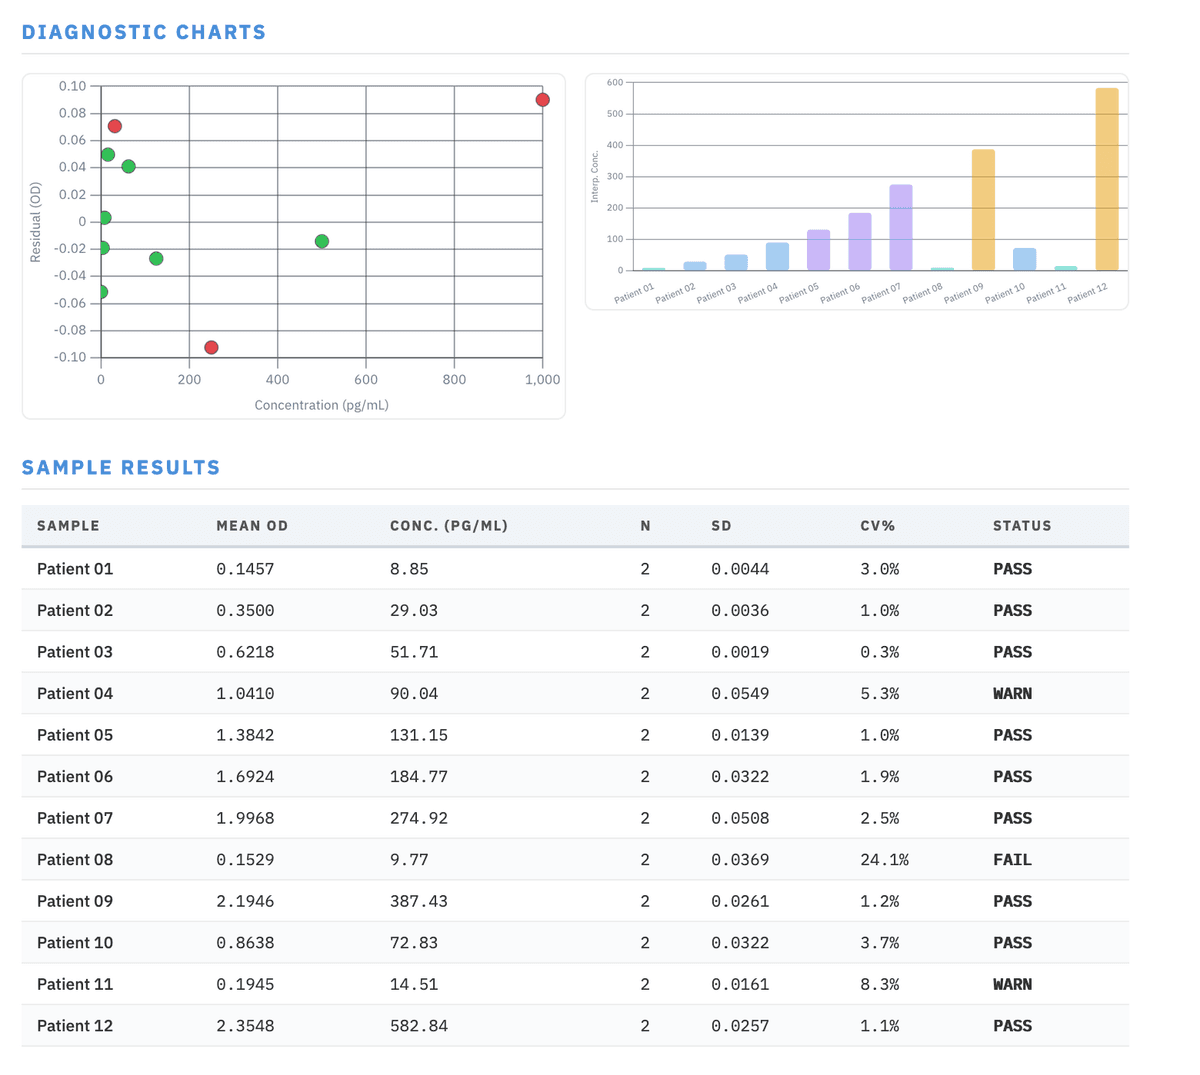
.xlsx.xls.csv - The tool fits a 4-parameter logistic (4PL) curve and computes R², residuals, and interpolated concentrations
- CV% is calculated for any group with 2+ readings — singlets show "n=1"
Beta — results should be independently verified. Not for clinical or diagnostic use.